Preliminary Analysis of Federal Grant Market Changes: October 2024 - July 2025 Snapshots


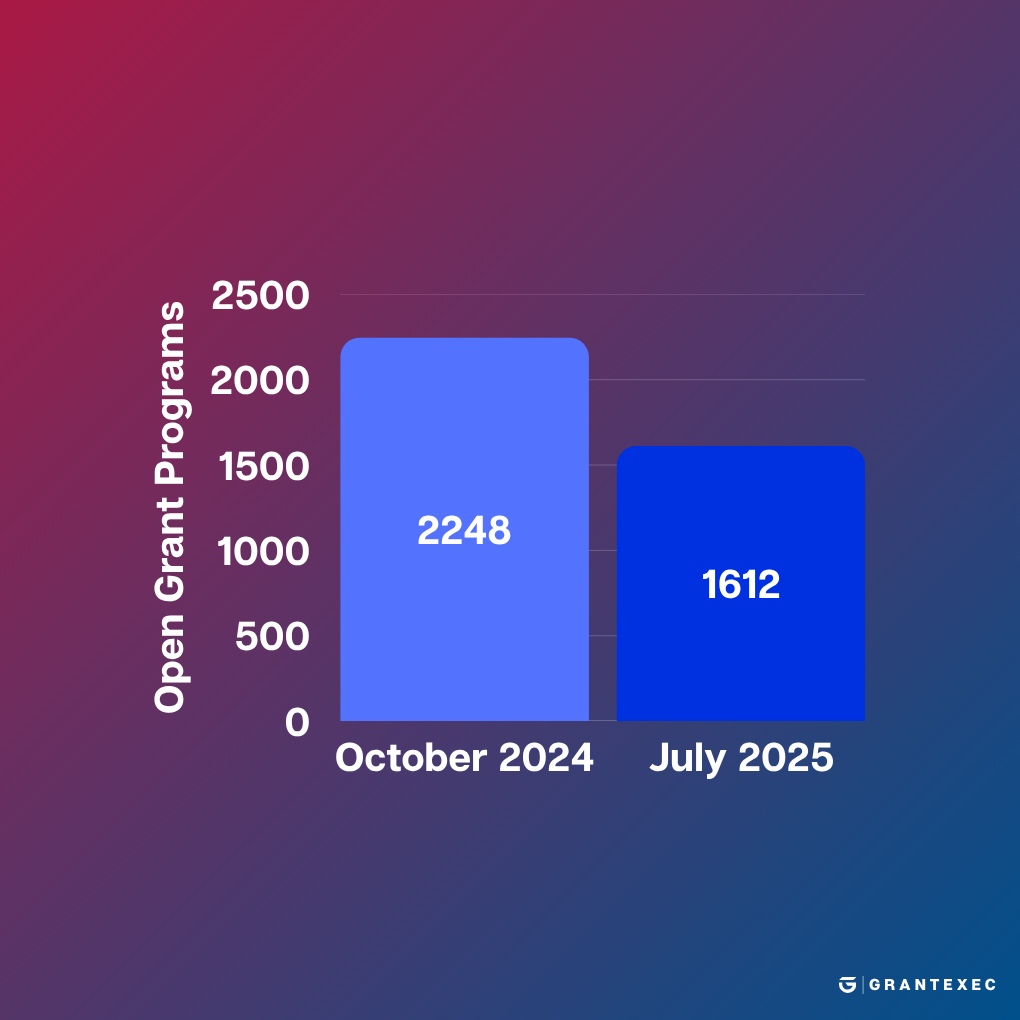
This preliminary analysis examines federal grant market data from two snapshots: October 5, 2024, and July 5, 2025. The data shows substantial changes during the first six months of the Trump administration's second term. Total available funding decreased from $93.1 billion to $47.7 billion (48.8% reduction) and active grants declined from 2,248 to 1,612 (28.3% reduction).
Federal Grant Market Transformation
Methodology and Limitations
This analysis compares two single-day snapshots of federal grant postings. Key limitations include:
Point-in-time data may not reflect full grant cycles
No trend data exists between these dates
Classification changes may affect comparability
Findings
Overall Market Indicators
The snapshots show:
Active Grants: Decreased by 636 (28.3%)
Available Funding: Reduced by $45.4 billion (48.8%)
Weekly Activity: New grants added per week increased from 69 to 73, while weekly funding decreased from $6.5B to $1.1B
Average Grant Size: Increased from $41.4 million to $29.6 million
Agency-Level Changes
Agencies at Zero in July Snapshot
USAID: From 47 grants ($1.56B) to zero
AmeriCorps: From 20 grants to zero
NASA, Library of Congress, Millennium Challenge Corporation: All at zero
Major Agency Shifts
Environmental Protection Agency: 36 grants to 1 grant; $4.45B to $40M
Department of Defense: 104 to 136 grants
Department of State: 25 to 65 grants
Department of Health and Human Services: Stable grant count, major funding decrease
Sectoral Changes
Increases:
Education: $3.0B to $8.7B
Business and Commerce: $737.1M to $9.6B
Science and Technology: $23.0B to $25.4B
Decreases:
Environment: $17.6B to $5.8B
International Development: $1.7B to $809.4M
Agriculture: $846.2M to $565.5M
Eligible Entity Shifts
State governments gained substantially in grants and funding
Small businesses saw major increases in eligibility
Native American tribal organizations experienced decreases
Preliminary Interpretations
The data suggests:
Program Consolidation: Fewer grants with larger average awards
State-Level Shift: Increased state government funding indicates more state-administered programs
Sectoral Realignment: Clear movement between federal priorities
Conclusion
These snapshots indicate substantial changes in the federal grant landscape between October 2024 and July 2025. While the data reveals significant shifts in funding priorities and program administration, additional analysis will determine whether these changes represent temporary transitions or permanent policy shifts.

